All projectsData platform · Maritime intelligence

Real project

40+ countries of shipping reports, turned into one daily dataset.

An automated operating system that turns inconsistent maritime reports into clean, daily, decision-ready datasets across more than 40 countries.

40+countries, one reliable flow
The problem
Vessel updates arrived by email in different PDF and Excel formats from 40+ countries. Data was late, duplicated, and missing updates went unnoticed.
What I built
An automated pipeline from inbox to Snowflake, with daily Power BI monitoring of delays and data quality.
My role
Designed and built the pipeline and the data quality tools the team uses today, from defining the rules to running them. I now lead the four-person team that runs it. Junior Data Analyst → Head of Lineups Team.
Result
70%+ fewer manual follow-ups. Daily automated delivery across 40+ countries.
Why it was hard
  • PDF and Excel layouts that change between reports
  • Different port vocabularies and reporting rhythms
  • Late, missing and overlapping vessel updates, every day
Tools
Python · Pandas · PDF/Excel parsing · SQL · Snowflake · Power BI

INTERACTIVE PROOF

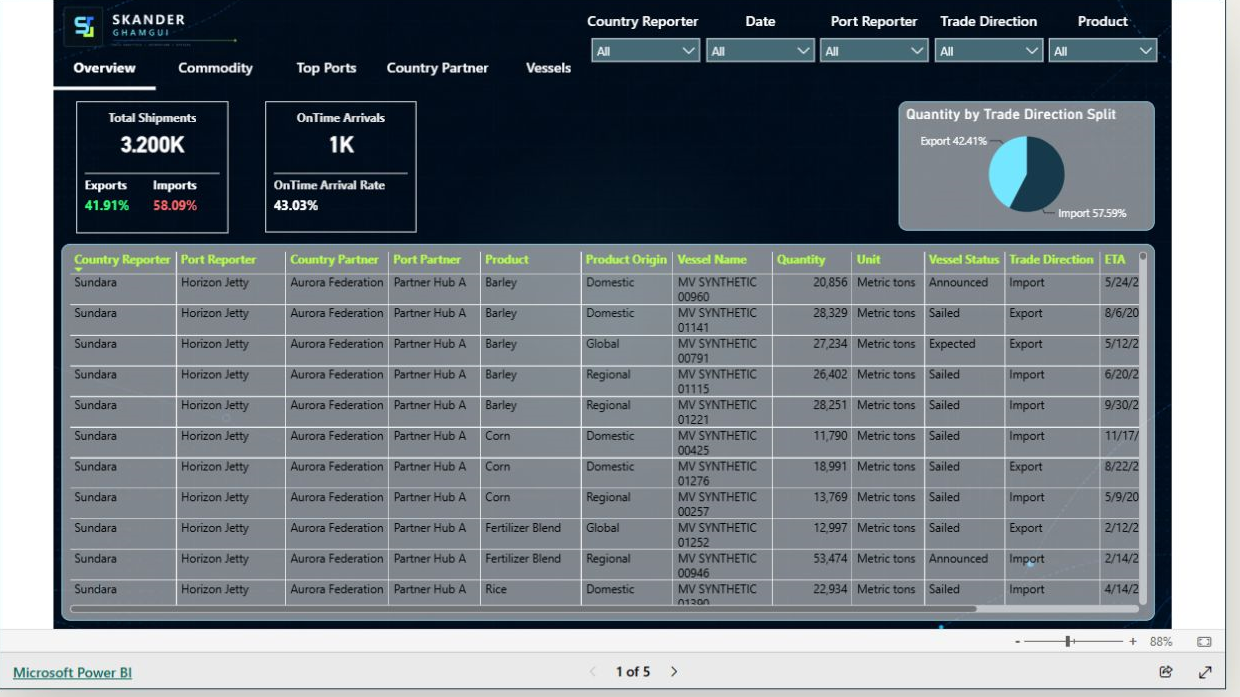
Explore the Lineups Dashboard.

OPEN FULL DASHBOARD
Overview page of Skander Ghamgui's synthetic Lineups Dashboard
MOBILE PREVIEW

The full report is designed for a wider analytical canvas. Open it in Power BI to use the filters, pages and drill interactions.

OPEN INTERACTIVE REPORT
LOADING INTERACTIVE REPORT

Connecting to the synthetic public demo…

SQL EXAMPLE

How the sources are merged: the SQL

A simplified version of the Snowflake query I use to merge three lineup sources into one deduplicated dataset. Names are placeholders; the structure follows my production query.

-- Merge three vessel lineup sources into one deduplicated dataset (Snowflake).
-- All database, table and source names are placeholders.
WITH all_sources AS (
  -- each source exposes the same columns
  SELECT *, 'source_a' AS src FROM demo_db.lineups.source_a_daily
  UNION ALL
  SELECT *, 'source_b' AS src FROM demo_db.lineups.source_b_weekly
  UNION ALL
  SELECT *, 'source_c' AS src FROM demo_db.lineups.source_c_weekly
  WHERE "ETS Reporter" < DATE '2025-04-01'
),

-- Step 1: normalize the matching keys
normalized AS (
  SELECT *,
    TRIM(LOWER(SPLIT_PART("Vessel Name", '/', 1))) AS vessel_key,
    "Product":"Code"::STRING AS product_code,
    TO_DATE("ETS Reporter") AS ets_date,
    -- quantity bands about 10% wide, on a log scale
    IFF("Quantity" > 0, FLOOR(LN("Quantity") / LN(1.1)), 0) AS quantity_band
  FROM all_sources
),

-- Step 2: start a new group when reports are more than 9 days apart
flagged AS (
  SELECT *,
    IFF(DATEDIFF(day,
          LAG(ets_date) OVER (PARTITION BY vessel_key, product_code, quantity_band
                              ORDER BY ets_date, src),
          ets_date) > 9, 1, 0) AS new_group
  FROM normalized
),
grouped AS (
  SELECT *,
    SUM(new_group) OVER (PARTITION BY vessel_key, product_code, quantity_band
                         ORDER BY ets_date, src
                         ROWS UNBOUNDED PRECEDING) AS time_group
  FROM flagged
),

-- Step 3: count how many sources report the same shipment
counted AS (
  SELECT *,
    COUNT(DISTINCT src) OVER (PARTITION BY vessel_key, product_code,
                                           quantity_band, time_group) AS sources_in_group
  FROM grouped
)

-- Step 4: keep single-source shipments; when several sources report one, drop source A's copy
SELECT
  "Cut-Off Date",
  src AS data_source,
  "Country Reporter":"Code"::STRING AS country_reporter,
  "Port Reporter":"Code"::STRING AS port_reporter,
  "Trade Direction":"Code"::STRING AS trade_direction,
  product_code,
  "Quantity",
  "Vessel Name",
  "Vessel IMO",
  ets_date
FROM counted
WHERE sources_in_group = 1 OR src <> 'source_a'
ORDER BY vessel_key, product_code, quantity_band, time_group, ets_date;
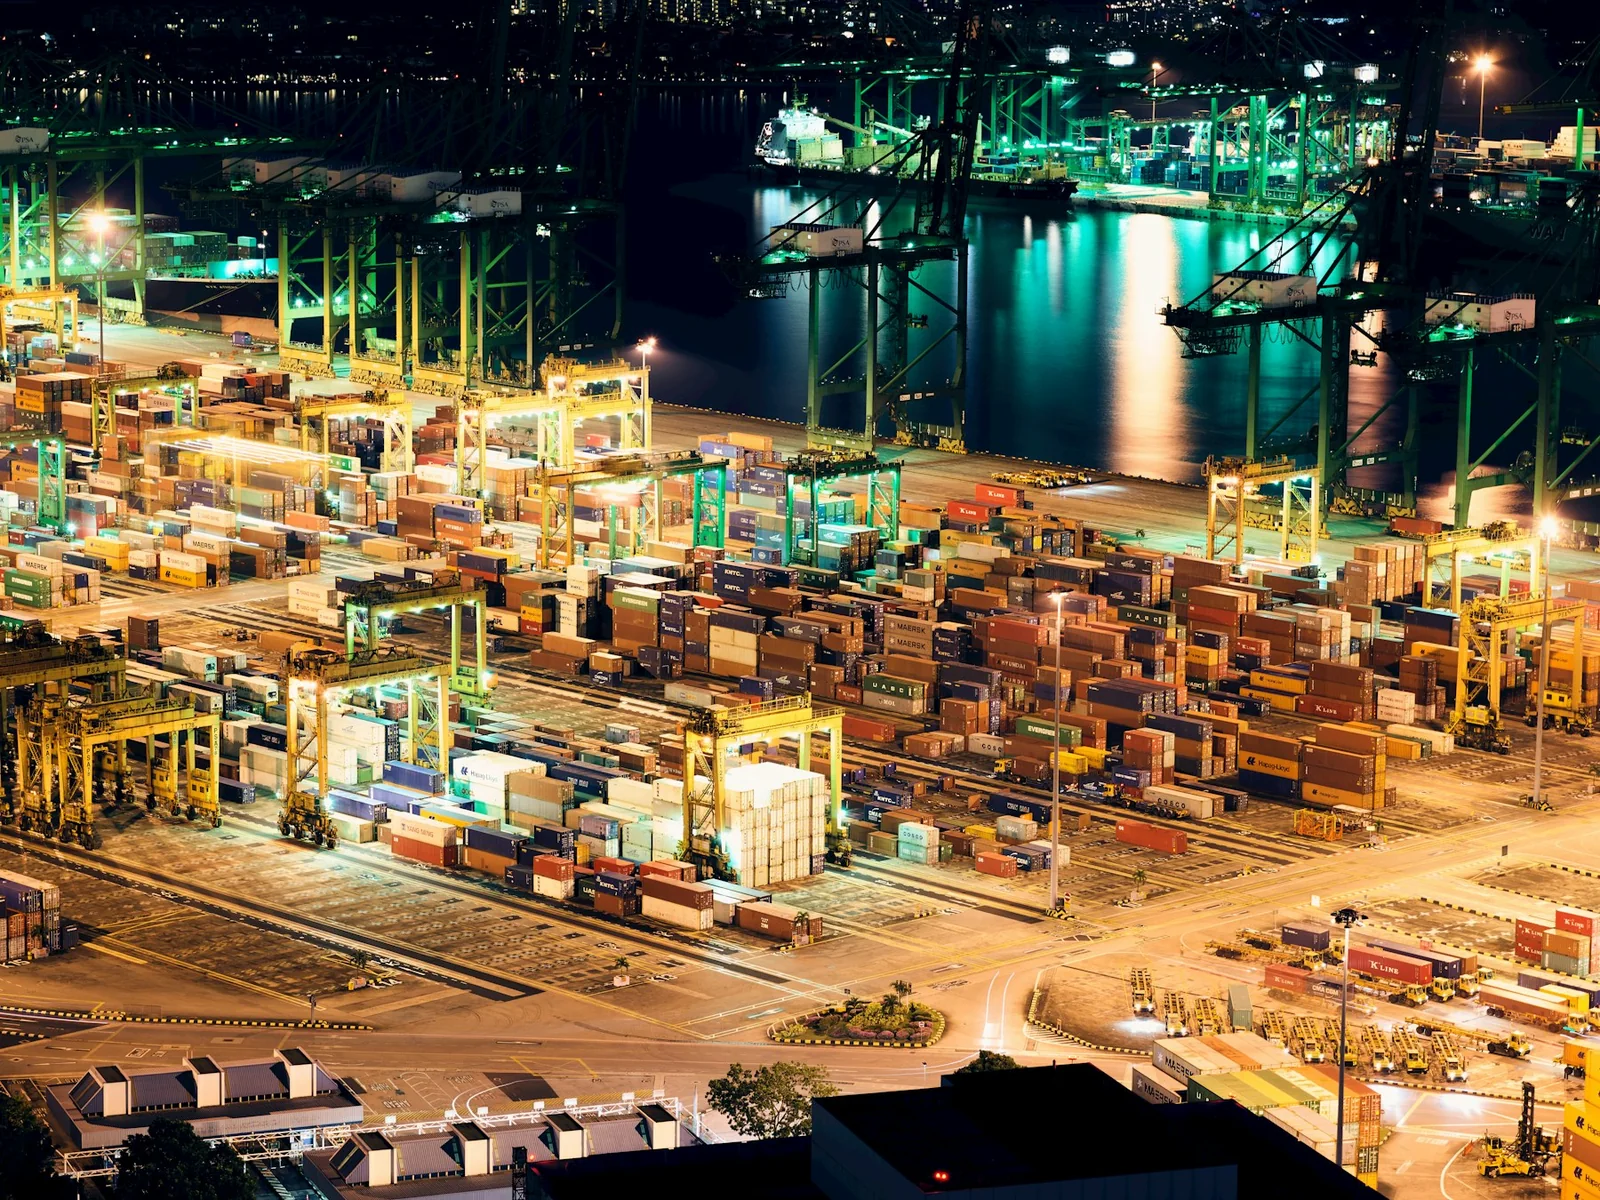
Container port and cargo ship viewed from above
Illustrative photo.

THE PROBLEM

Why the system needed to exist.

Critical vessel updates arrived through different email formats, attachments and reporting conventions. Manual handling made freshness uneven, introduced duplicate records and made missing updates difficult to detect.

MY ROLE

Where I created leverage.

I designed and built the pipeline end to end, then led the operating model around it: source intake, parsing, standardization, mapping, quality control, delivery and team accountability.

Technical details

SYSTEM FLOW

From friction
to a repeatable flow.

  1. Email detection
  2. Attachment routing
  3. PDF / Excel parsing
  4. Normalization
  5. Deduplication
  6. Mapping
  7. Snowflake ingestion
  8. Monitoring

CONSTRAINTS

The difficult parts.

  • PDF and Excel attachments with shifting layouts
  • Different port vocabularies and reporting rhythms
  • Late, missing and overlapping vessel updates
  • Daily delivery expectations across a global footprint

DESIGN DECISIONS

How I approached them.

  • Preserved each source's audit trail while normalizing the analytical output.
  • Separated source-specific parsing from shared cleaning and mapping rules.
  • Added missing-update tracking and arrival prediction where reporting was inconsistent.
  • Connected operational exceptions to daily Power BI monitoring instead of hiding them in logs.

OUTCOMES

Project outcomes

40+

country pipelines

One operating model across heterogeneous sources.

Daily

automated delivery

From incoming files to platform-ready records.

70%+

fewer follow-ups

Through prediction and missing-update logic.

TECHNICAL SURFACE

PythonPandasAPIsPDF parsingExcel parsingSnowflakePower BI
NEXT SYSTEM / 03

30+ trade sources that disagreed, compared on one dashboard.